
Performance Dashboards and KPI Tracking for Better Decision-Making
In today’s competitive business environment, organizations generate large amounts of data every day. However, collecting data alone is not enough. Businesses must understand, analyze, and use that information effectively to improve operations, customer experience, and overall performance. This is where Performance Dashboards and KPI Tracking play an important role. They help organizations monitor business activities, measure success, identify problems quickly, and make informed decisions based on real-time data.
Performance dashboards and Key Performance Indicators (KPIs) are widely used by businesses, government organizations, healthcare providers, educational institutions, and many other industries. They simplify complex information and present it in a visual format that is easier to understand and analyze.
Understanding the difference between market research and customer feedback is important for organizations that want to make informed business decisions, improve customer experiences, and build long-term growth strategies. Both approaches are valuable, but they are used at different stages of business planning and customer engagement.
What are Performance Dashboards?
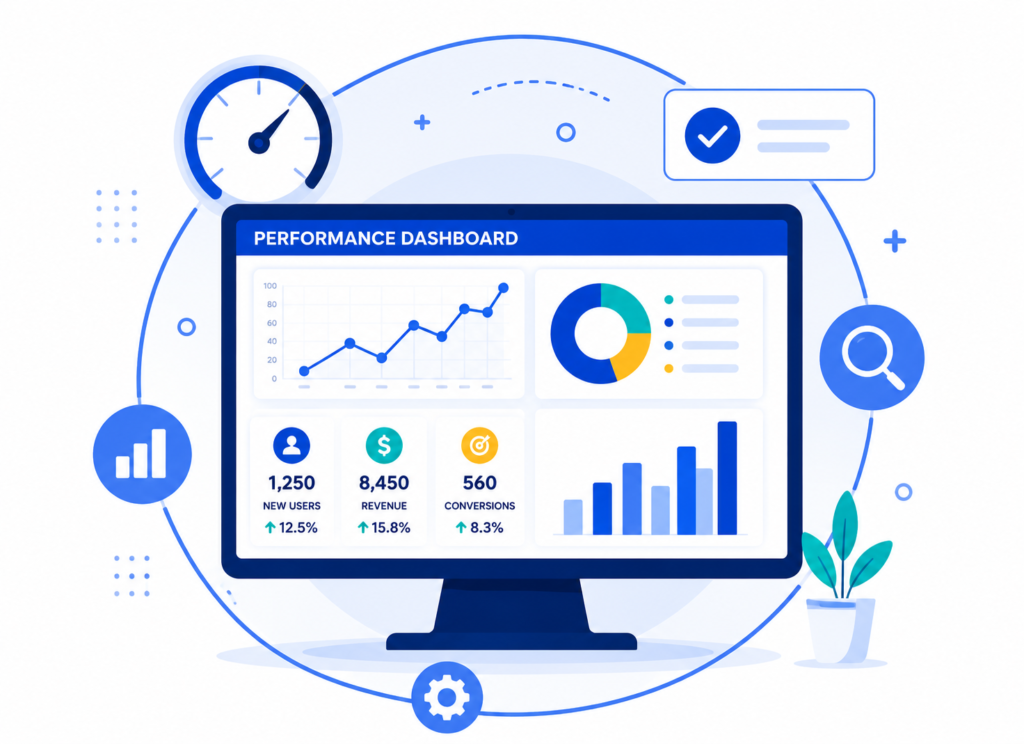
A performance dashboard is a visual reporting tool that displays important business data, metrics, and performance indicators in one place. It allows managers, executives, and teams to monitor organizational performance in real time. Dashboards usually include charts, graphs, tables, scorecards, and summaries that provide quick insights into business activities.
Performance dashboards are designed to help businesses track progress toward specific goals and objectives. Instead of reviewing lengthy reports or spreadsheets, decision-makers can easily access important information through a dashboard and take faster actions when required.
For example, a sales dashboard may display monthly revenue, conversion rates, customer acquisition numbers, and sales team performance. Similarly, a customer service dashboard may track customer satisfaction scores, response times, and complaint resolution rates.
Understanding KPI Tracking
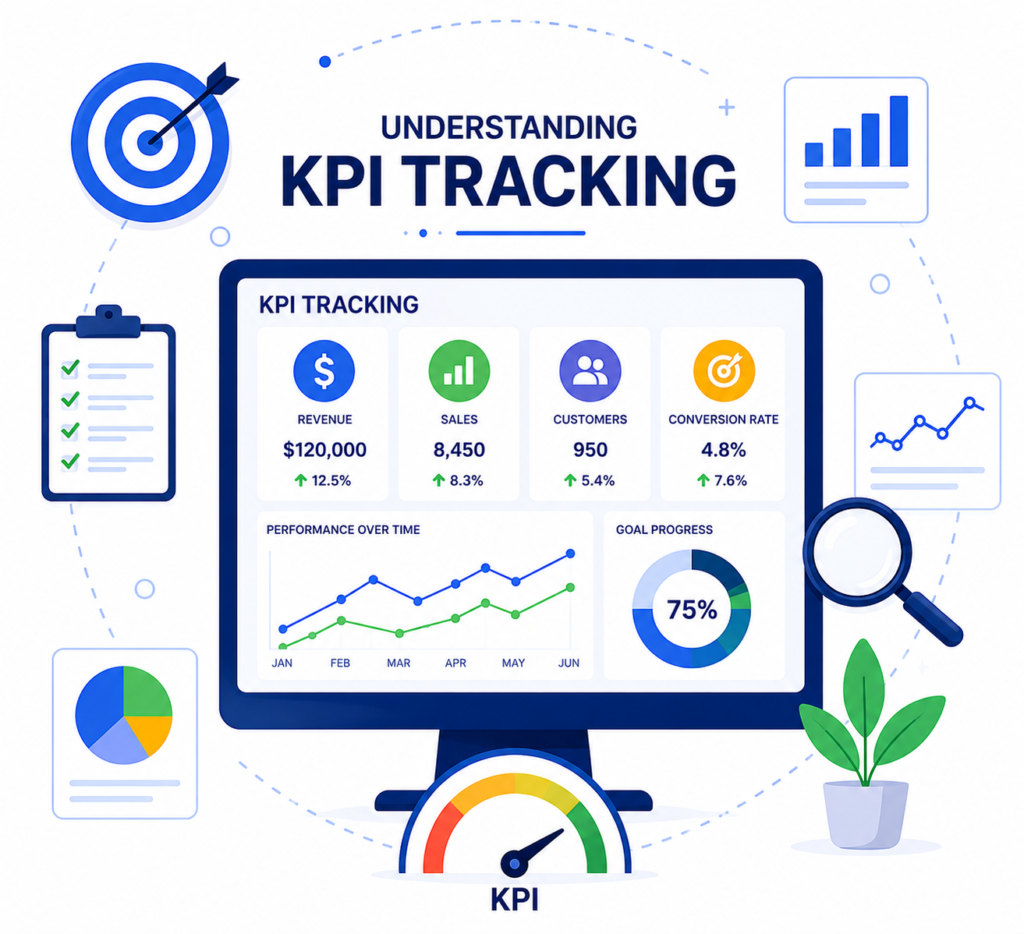
Key Performance Indicators (KPIs) are measurable values used to evaluate how effectively a business or department is achieving its objectives. KPI tracking refers to the process of monitoring these indicators regularly to assess performance and identify areas for improvement.
KPIs vary depending on the industry and business goals. Some common examples include:
- 1. Revenue growth
- 2. Customer retention rate
- 3. Employee productivity
- 4. Website traffic
- 5. Lead conversion rate
- 6. Customer satisfaction score
- 7. Project completion time
- 8. Operational efficiency
- 9. Profit margins
Effective KPI tracking helps businesses understand whether their strategies are working successfully or whether improvements are needed.
Importance of Performance Dashboards and KPI Tracking
Performance dashboards and KPI tracking provide several advantages for organizations. They support better planning, improve transparency, and help leaders make data-driven decisions.
Real-Time Business Monitoring: Dashboards provide real-time updates about business activities and performance metrics. Managers can quickly identify changes, trends, or problems without waiting for manual reports. This allows organizations to respond faster to operational issues and market changes.
Improved Decision-Making: Businesses can make more informed decisions when accurate data is easily available. Performance dashboards reduce guesswork and allow leaders to rely on measurable insights rather than assumptions.
Better Goal Alignment: KPI tracking helps teams stay aligned with organizational objectives. Employees can clearly understand performance expectations and monitor their progress toward business goals.
Increased Productivity: By identifying inefficiencies and bottlenecks, dashboards help organizations improve workflows and employee productivity. Teams can focus on areas that need attention and optimize overall performance.
Enhanced Transparency: Performance dashboards create transparency across departments by providing shared access to important data. This improves communication, accountability, and collaboration among teams.
Faster Problem Identification: Businesses can quickly detect declining performance, customer complaints, sales drops, or operational delays through dashboard alerts and KPI analysis. Early identification helps reduce risks and prevent larger problems.
Types of Performance Dashboards
Different organizations use different types of dashboards based on their operational needs and business goals.
Strategic Dashboards: Strategic dashboards are mainly used by senior management and executives. They focus on long-term business goals, organizational growth, and overall company performance.
Operational Dashboards: Operational dashboards monitor daily business activities and operational efficiency. These dashboards provide real-time information related to production, logistics, customer support, or inventory management.
Analytical Dashboards: Analytical dashboards help businesses analyze historical data, identify trends, and perform detailed performance analysis. They support data-driven planning and forecasting.
Tactical Dashboards: Tactical dashboards are commonly used by middle management to track departmental performance and short-term objectives.
Key Features of Effective Performance Dashboards
An effective performance dashboard should be simple, clear, and easy to understand. Some important features include:
- 1. Real-time data updates
- 2. User-friendly design
- 3. Interactive charts and graphs
- 4. Customizable reporting options
- 5. KPI scorecards
- 6. Data filtering capabilities
- 7. Mobile accessibility
- 8. Automated alerts and notifications
- 9. Integration with business systems
The dashboard should present only relevant information to avoid confusion and information overload
Industries Using KPI Dashboards
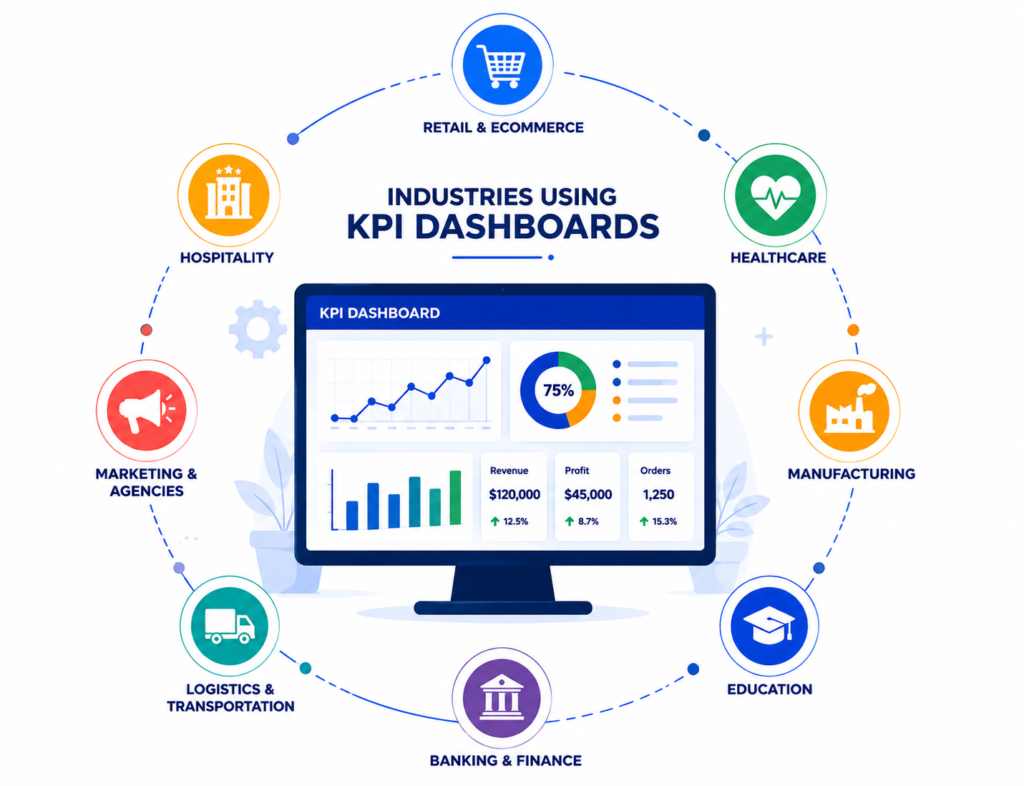
Performance dashboards and KPI tracking are useful across multiple industries and sectors.
Healthcare: Hospitals and healthcare providers use dashboards to monitor patient care quality, treatment efficiency, and operational performance.
Retail and E-commerce: Retail businesses track sales performance, customer behavior, inventory levels, and marketing effectiveness through dashboards.
Manufacturing: Manufacturers monitor production efficiency, machine performance, quality control, and supply chain activities.
Finance: Financial institutions use KPI dashboards for risk management, revenue analysis, compliance monitoring, and financial reporting.
Customer Service: Customer support teams track response times, customer satisfaction scores, ticket resolution rates, and service quality metrics.
Challenges in KPI Tracking and Dashboard Management
Although dashboards provide many benefits, organizations may face certain challenges during implementation.
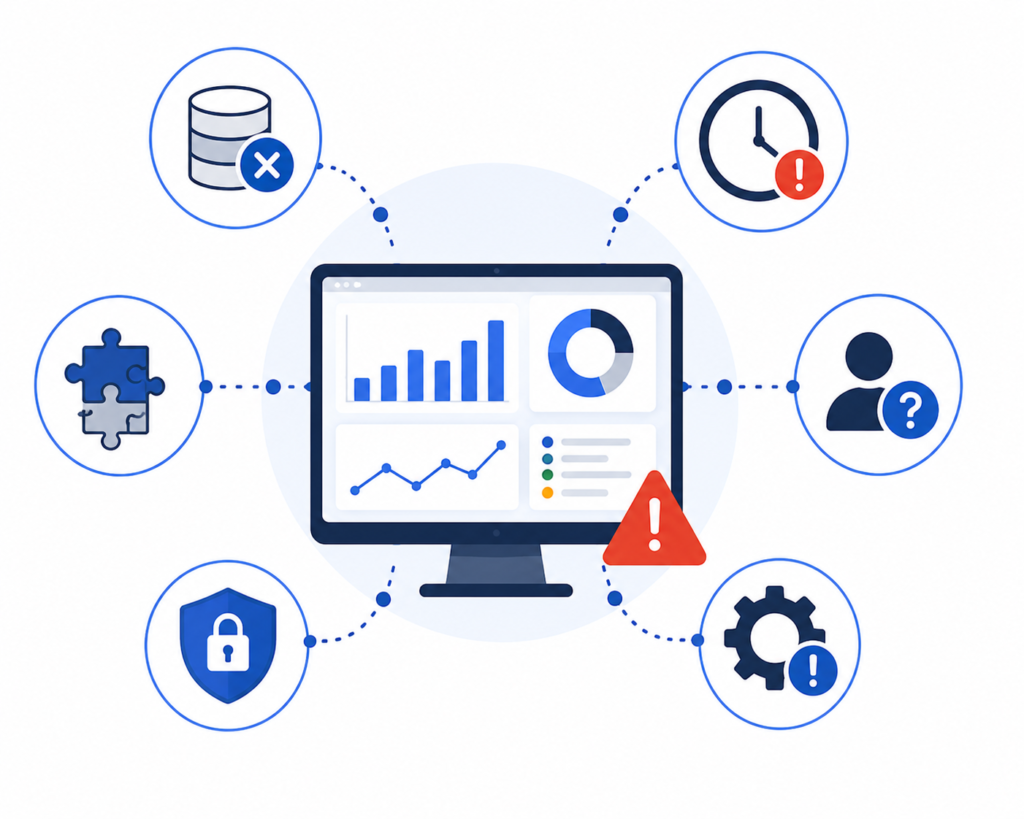
Some common challenges include:
- 1. Poor data quality
- 2. Inconsistent KPI definitions
- 3. Lack of employee training
- 4. Complex dashboard designs
- 5. Data integration difficulties
- 6. Information overload
- 7. Limited real-time data access
Businesses should focus on selecting meaningful KPIs, maintaining accurate data, and designing dashboards that are simple and actionable.
Best Practices for Effective KPI Tracking
To maximize the benefits of performance dashboards, organizations should follow some important best practices:
- 1. Define clear business objectives
- 2. Select relevant and measurable KPIs
- 3, Use accurate and updated data sources
- 4. Keep dashboard design simple and focused
- 5. Review KPIs regularly
- 6. Train employees on dashboard usage
- 7. Automate data collection whenever possible
- 8. Monitor performance trends consistently
Organizations should also ensure that dashboards are regularly updated according to changing business goals and market conditions.
Conclusion
Performance dashboards and KPI tracking have become essential tools for modern businesses seeking better decision-making and operational efficiency. They help organizations transform raw data into meaningful insights that support growth, productivity, and strategic planning. By providing real-time visibility into business performance, dashboards allow companies to identify opportunities, solve problems quickly, and improve overall organizational success.
When implemented effectively, KPI tracking systems can improve transparency, employee accountability, customer satisfaction, and long-term business performance. As businesses continue to rely more on data-driven strategies, performance dashboards will remain an important part of successful decision-making and business management.
